Introduction: Portfolio as a Living Entity
In parts 1 and 2 of this series, we addressed the importance of rigorous forecasting and effective asset prioritization. Combined, those components culminate in a strategically aligned portfolio. However, in the dynamic world of biopharma R&D, this is merely a snapshot in time. The variables that underpin value in biopharma are volatile: new clinical data emerges, competitors’ trials succeed or fail, regulatory landscapes shift, and market dynamics evolve rapidly.
Ongoing portfolio review and management is the essential governance process that transforms the static plan into a living, breathing entity. It enables an organization to adapt to new information, continuously re-evaluate its bets, and proactively steer its pipeline toward maximum value. It is the process by which leadership bridges high-level corporate strategy to ground-level operational execution. A disciplined and regular review process is the only way to effectively ensure that resources are always flowing to the most promising opportunities rather than to projects with low expected returns or those that are misaligned with the company’s strategic goals.
Here, we move beyond understanding value and asset prioritization to maintenance of value. We will dive into portfolio governance, the necessity of refreshing valuations, and advanced visualization tools. Furthermore, we will draw parallels from other high-risk industries and apply key lessons to biopharma portfolio management practices.
Establishing the Rhythm: Cadence and Governance
Effective portfolio management should enable strategic alignment, operational efficiency, and agility. The practice of annual portfolio reviews, often rigidly tied to budgeting cycles, is not sufficient, as annual processes can create decision lags.
Instead, a tiered approach to ongoing portfolio review and management works better.
- Annual Strategic Planning: This is the highest-level review in which senior leadership revisits the overarching corporate strategy, defines or reaffirms the company’s portfolio philosophy, and sets high-level investment goals and priorities for each therapeutic area (TA). This session is less about individual assets and more about the overall portfolio strategy.
- Quarterly/Semi-Annual Portfolio Prioritization Review: This is the forum for making major investment decisions in which leaders make the tough go/no-go calls on key projects and formally reallocate capital and resources. The discussion is strategic, focusing on the trade-offs required to optimize the portfolio based on the latest data and market intelligence.
- Monthly Project/Portfolio Health Checks: These reviews are operational and tactical. They are not for making major strategic shifts (i.e., re-opening strategy every month) but for monitoring the execution of high-priority programs. The focus is on tracking progress against milestones, identifying and mitigating risks, resolving operational bottlenecks, and ensuring that key projects remain on track.
While a calendar-based cadence provides predictability, it must be augmented by trigger-based reviews. A trigger-based approach mandates that specific events automatically call for a portfolio review, regardless of the calendar date. Critical triggers for ad hoc reviews include:
- Clinical Readouts: A binary event (pass/fail) for a major asset or a direct competitor’s asset
- Regulatory Shifts: New guidance from the FDA or EMA that alters the development path (e.g., changing endpoints for Alzheimer’s trials)
- Commercial Impact: The launch of a competitor drug with a superior profile or aggressive pricing strategy
- Business Development: A potential M&A opportunity that would require significant capital reallocation from the internal pipeline
Refreshing Valuations
In financial markets, “Mark-to-Market” accounting ensures that an asset’s value on the balance sheet reflects its current fair market value. In biopharma portfolio management, a similar discipline is required.
If the Probability of Technical Success (PTS) is not updated after a Phase 2 readout, or if the projected market share is not adjusted following a competitor’s strong launch, the rNPV (risk-adjusted Net Present Value) becomes misleading. Like critical triggers, the key areas to evaluate for a valuation refresh can include commercial, technical, operational, and financial inputs. We covered these in detail in parts 1 and 2.
Visualizing the Portfolio
To facilitate high-impact, data-driven conversations, leadership teams rely on powerful data visualization tools that can transform complex trade-off decision-making processes into an intuitive, strategic alignment. Two of the most essential tools are Risk-Reward Bubble Charts and Efficiency Frontiers.
Risk-Reward Bubble Chart
This is a classic and indispensable tool for visualizing portfolio balance. It plots the entire portfolio on a quadrant view, allowing leadership to assess its composition in one graph.
- Y-Axis (Reward): Represents the potential value of each project using NPV or Peak Sales
- X-Axis (Risk): Represents the probability of success (PTRS %); probability of success increases as you go from left to right
- Bubble Size: Represents the total R&D investment required (cost to launch). This immediately highlights the scale of investment needed on top of expected value and risk
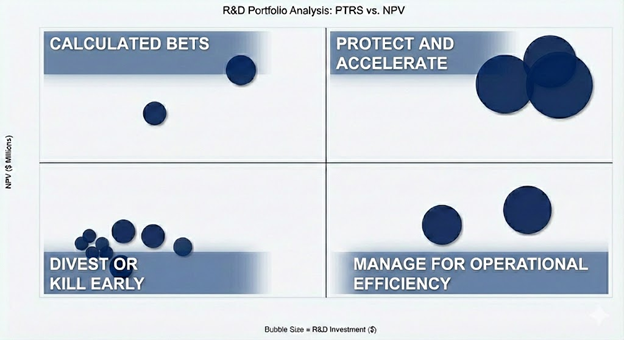
Strategic Quadrants:
| Protect and Accelerate | Low Risk / High Reward | Fully fund and resource. Remove all operational barriers. |
| Calculated Bets | High Risk / High Reward | Fund a select few to fuel long-term growth. Manage them with a "kill fast" approach. |
| Manage for Operational Efficiency | Low Risk / Low Reward | Essential for stability and near-term revenue, but over-reliance stifles innovation. |
| Divest or Kill Early | High Risk / Low Reward | This is the "Kill Zone.” These projects can drain resources with low expected returns. |
Important Considerations:
- Plotting programs across all stages of development on the same view can lead to prioritization of late-stage programs over early-stage bets. It is important to review these by phase of development to maintain a balance between near-term wins vs. longer-term innovation.
- A common mistake is viewing this chart statically. The best practice is to track the migration of bubbles over time. Did a program drift from Low Risk to High Risk because of a new safety signal that was observed in competitor data? Tracking this migration provides a dynamic view of value creation or destruction.
Efficiency Frontiers
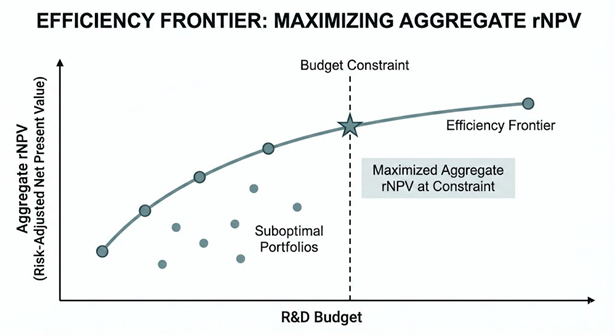
While the bubble chart provides a diagnostic snapshot, the Efficiency Frontier is a prescriptive tool that helps leaders understand the optimal trade-offs available to them given constraints. The efficiency frontier plots the maximum possible portfolio value (e.g., aggregated rNPV) that can be achieved for any given level of constraint, such as total R&D budget.
- The Curve: The frontier itself is a curved line representing the “Pareto Optimal” set of portfolios.
- On the Frontier: Any portfolio on the curve is “efficient” – it is mathematically impossible to get more return for the same level of risk/cost.
- Inside the Frontier: Any portfolio plotted below or inside the curve is suboptimal. It means the company is leaving value on the table. It could achieve higher returns for the same spend by reallocating resources
The frontier transforms the dialogue from “Which projects do we like?” to “How do we move to the curve?”
- Gap Analysis: If the current portfolio is well below the frontier, it signals operational inefficiency or poor project selection.
- M&A: The frontier analysis can identify “holes” in the portfolio. It might reveal that to reach the frontier, the company needs an asset with a specific profile (e.g., mid-risk, mid-reward) that it currently lacks.
- Scenario Planning: Leaders can model how the frontier shifts under different scenarios.
Drawing Parallels: Lessons from Other Industries
Different industries also face the same problems: high uncertainty, long timelines, and asymmetric returns. Their portfolio approaches offer direct lessons for biopharma R&D.
| Oil & Gas | Venture Capital | Technology | |
|---|---|---|---|
| The Parallel | Wildcat drilling under geological uncertainty | Power-law returns: a few wins pay for many failures. | Agile product development under fast feedback loops |
| The Hard Truth | A dry hole is abandoned immediately; no discussion. | Most investments will fail. | Perfect products don’t matter if assumptions are wrong. |
| Portfolio Discipline | Separate exploration from production. | Milestone-based funding; kill fast (losers) and double down (winners) | Minimum Viable Products (MVPs); rapid iteration to test the riskiest assumptions |
| Takeaways for Biopharma | Clear and pre-defined go/no-go criteria. Avoid seeking new indications to justify sunk cost. | Fund interim analyses to pick winners; allow additional capital to be deployed to clear winners. Avoid large upfront funding. | Design smaller trials to answer “kill” questions vs. designing large trials that answer all questions at once. |
Across industries, the lesson is consistent: portfolio success is less about predicting winners and more about enforcing capital discipline under uncertainty.
The Iterative Loop of Value Creation
In the end, portfolio management is not a math problem; it is a management philosophy around capital allocation. It is the discipline of making decisions in the face of uncertainty.
By moving from static annual plans to dynamic, trigger-based reviews enabled by continuous refinement of valuations, powerful visualizations, and leveraging insights from other industries, biopharma leaders can build portfolios that are resilient, diverse, and capable of delivering sustainable value that ties back to corporate strategy. Organizations that master this capability will be the ones that can navigate through patent cliffs, manage regulatory shifts, and deliver medicines that transform patients’ lives.
Blue Matter offers the expertise, tools, and processes to help biopharma companies optimize portfolio management, effectively manage risk, and realize more value from their assets. Please contact us via our website to schedule an introductory call. In addition, please follow Blue Matter on LinkedIn to stay up to date on our latest publications.